This post is old and probably irrelevant today.
12 July 2019
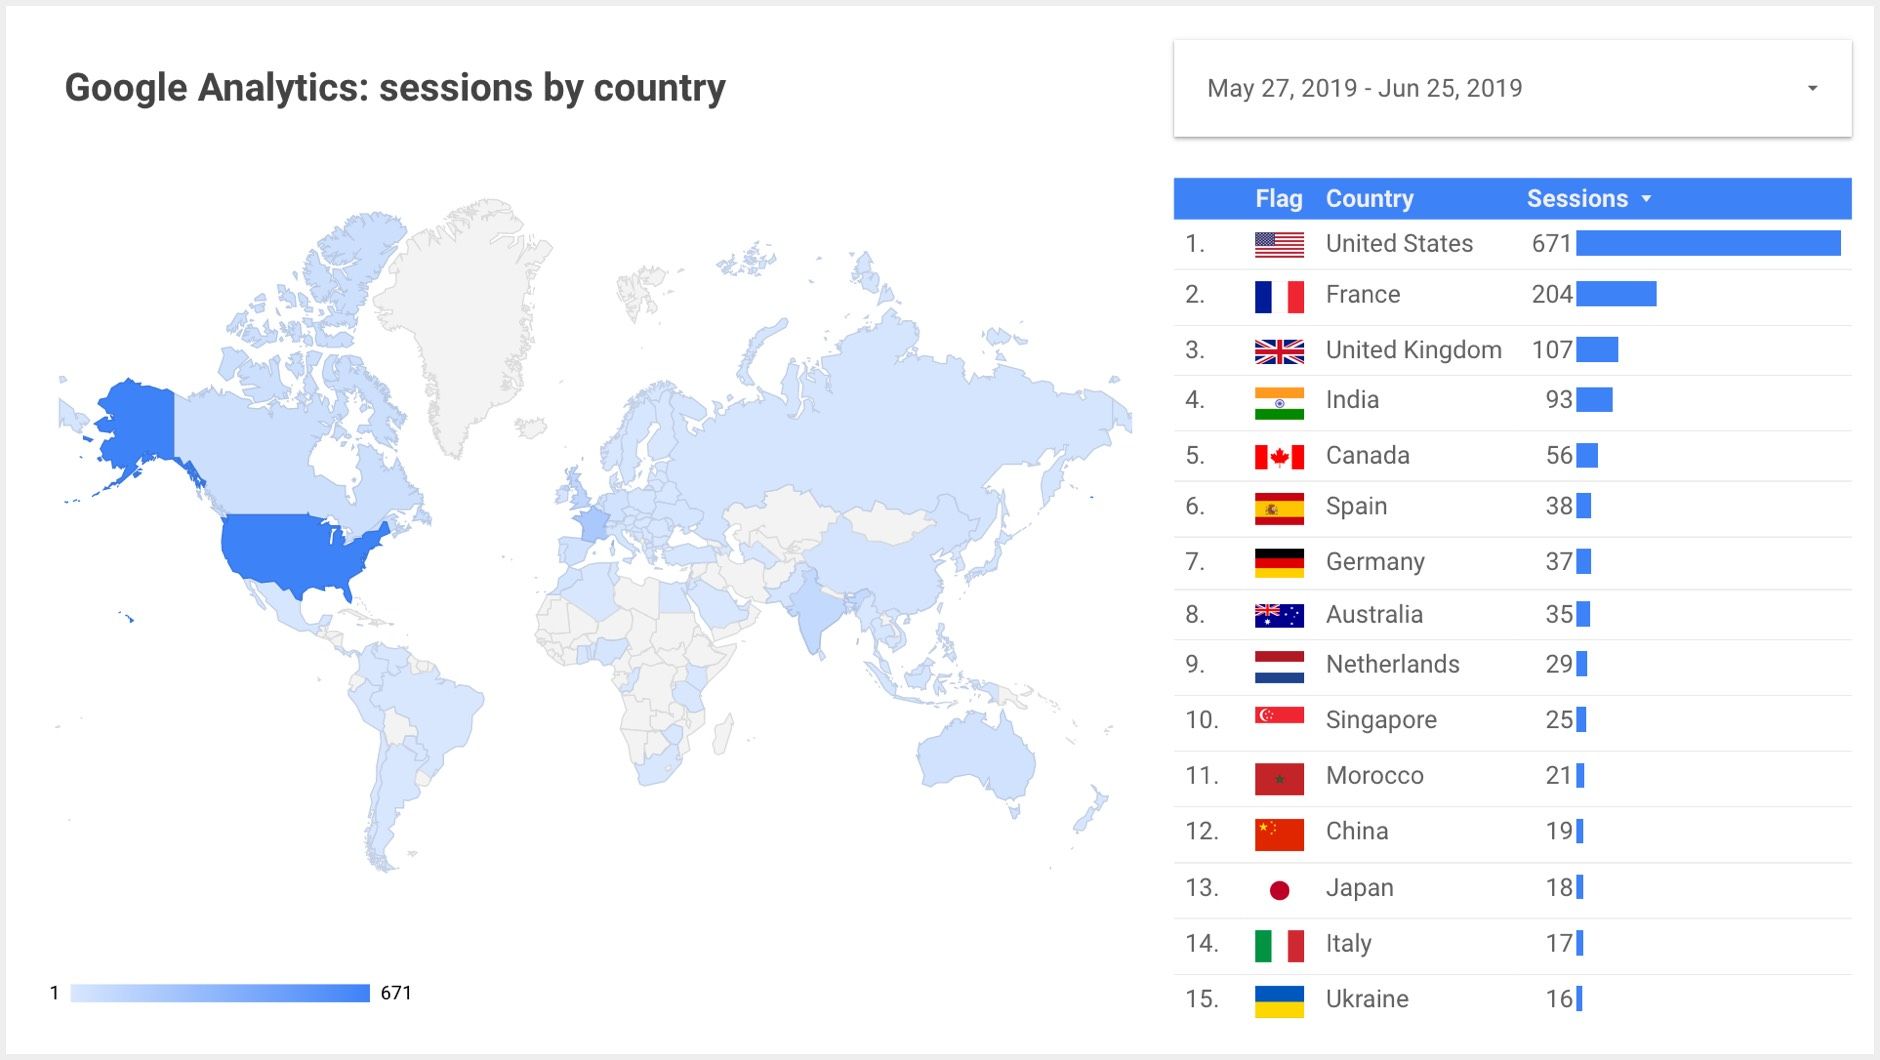
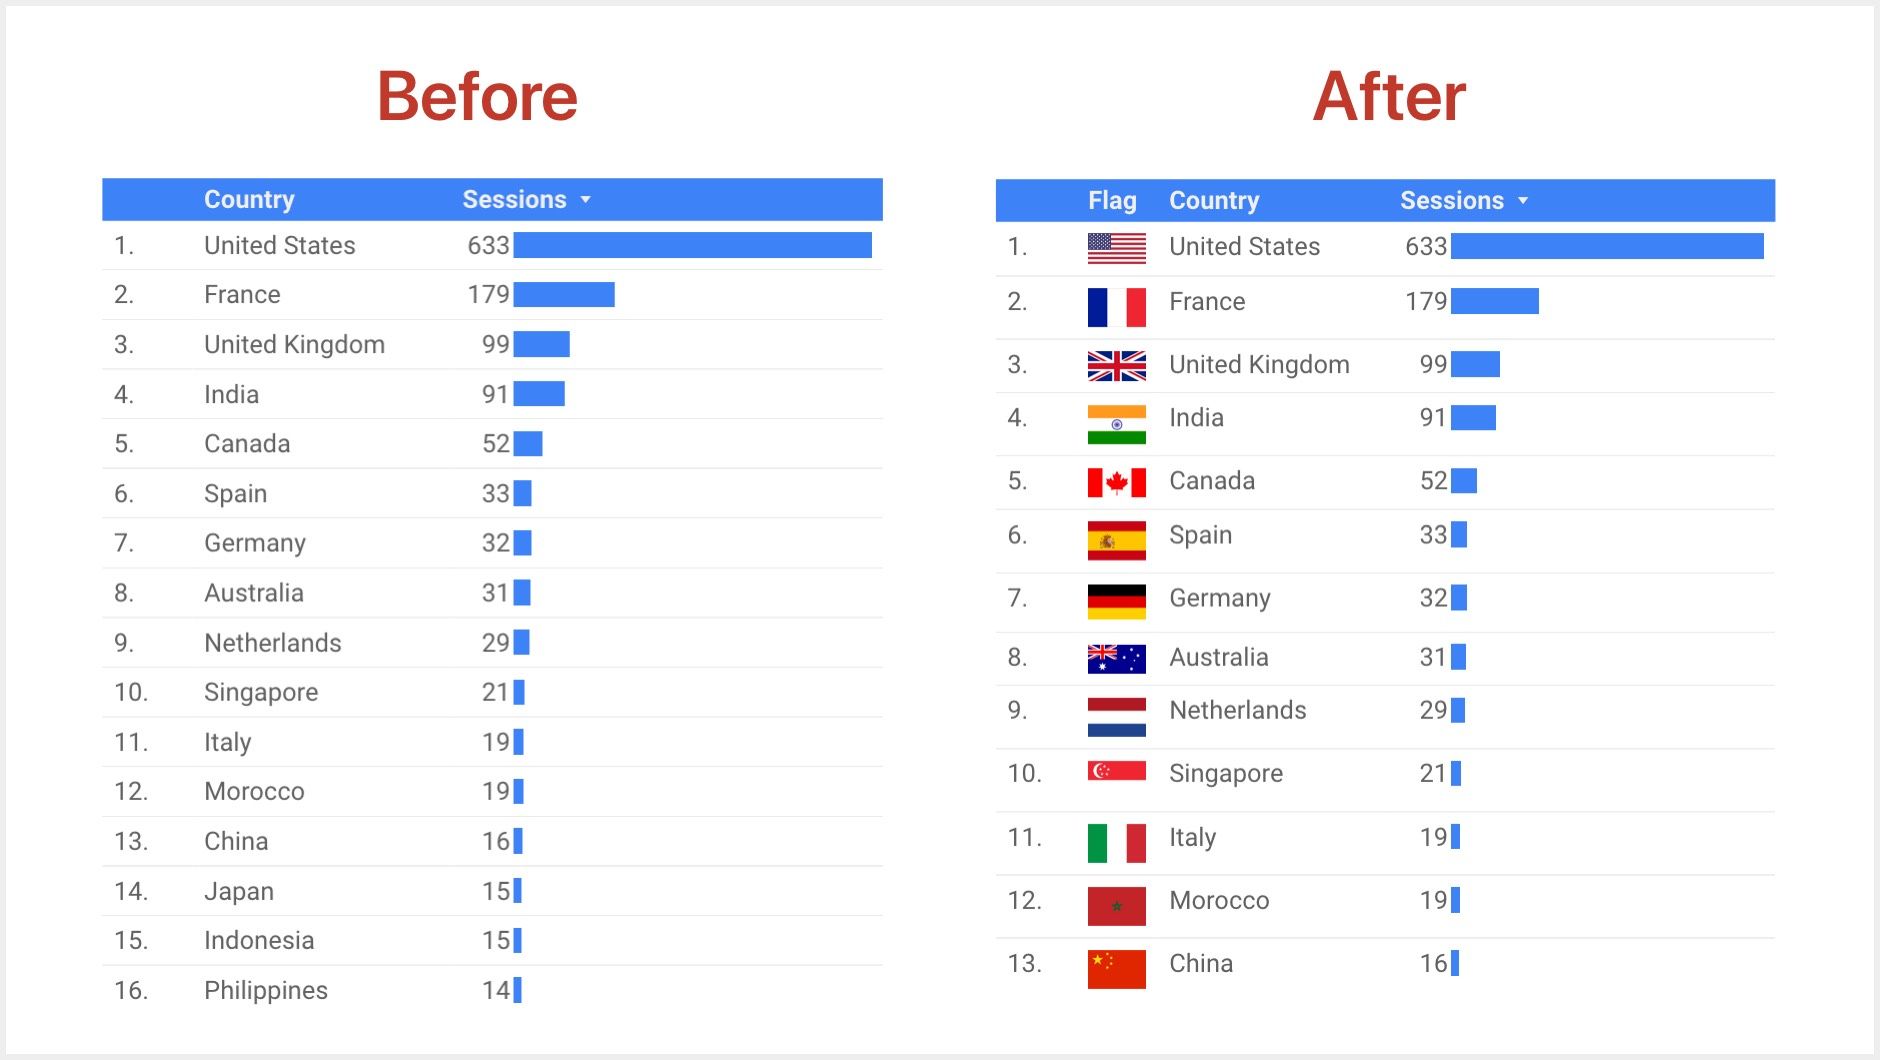
How to add country flags to a Google Data Studio table
Data Studio doesn't have an option to display country flags in your table charts. But it's easy to create a country flag column yourself.
As we saw in this article, you can add images to tables. We will use the same technique to compose the urls of the flags from their country codes.
Step 1: Make sure you have country codes
You need a field containing two-letters ISO codes for your countries. If your data source is Google Analytics, this information is already available in the "Country ISO Code" field. It contains values like: US, FR, GB, IN...
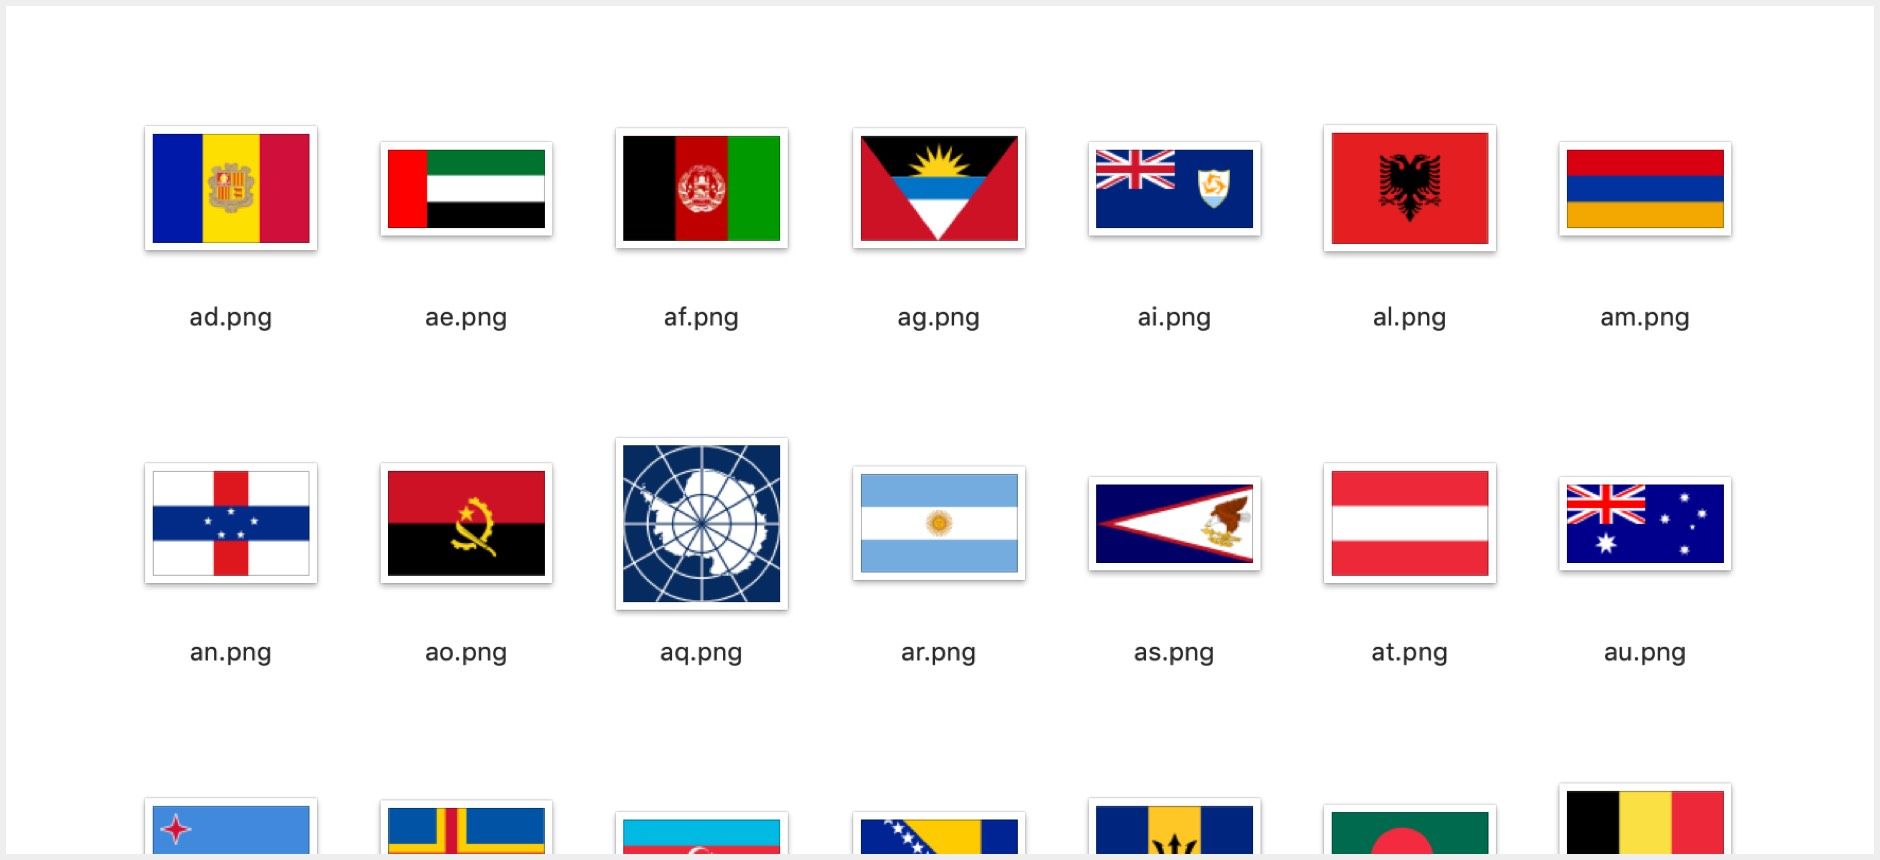
Your codes should match the names of the images we will use in the next step:
Step 2: Decide where to host the flag images
To display images in your reports, these images need to be accessible somewhere on the Internet.
You can either:
1- Link directly to our images, available here:
https://gds.baguette.engineering/flags/
Example:
https://gds.baguette.engineering/flags/ca.png
2- Host these images yourself, after downloading them here:
https://github.com/BaguetteEngineering/gds
Example:
https://example.com/flags/ca.png
About these images:
- We use a collection of flags created by Hampus Nilsson. It's available in this Github repo. You can preview the flags here. Thanks, Hampus!
- As the author says: "The source files were taken from Wikipedia and are not under copyright protection since flags are effectively in public domain".
Step 3: Create a new image field for your flags
Create a new calculated field on your data source. Give it a name, then write a formula like this one:
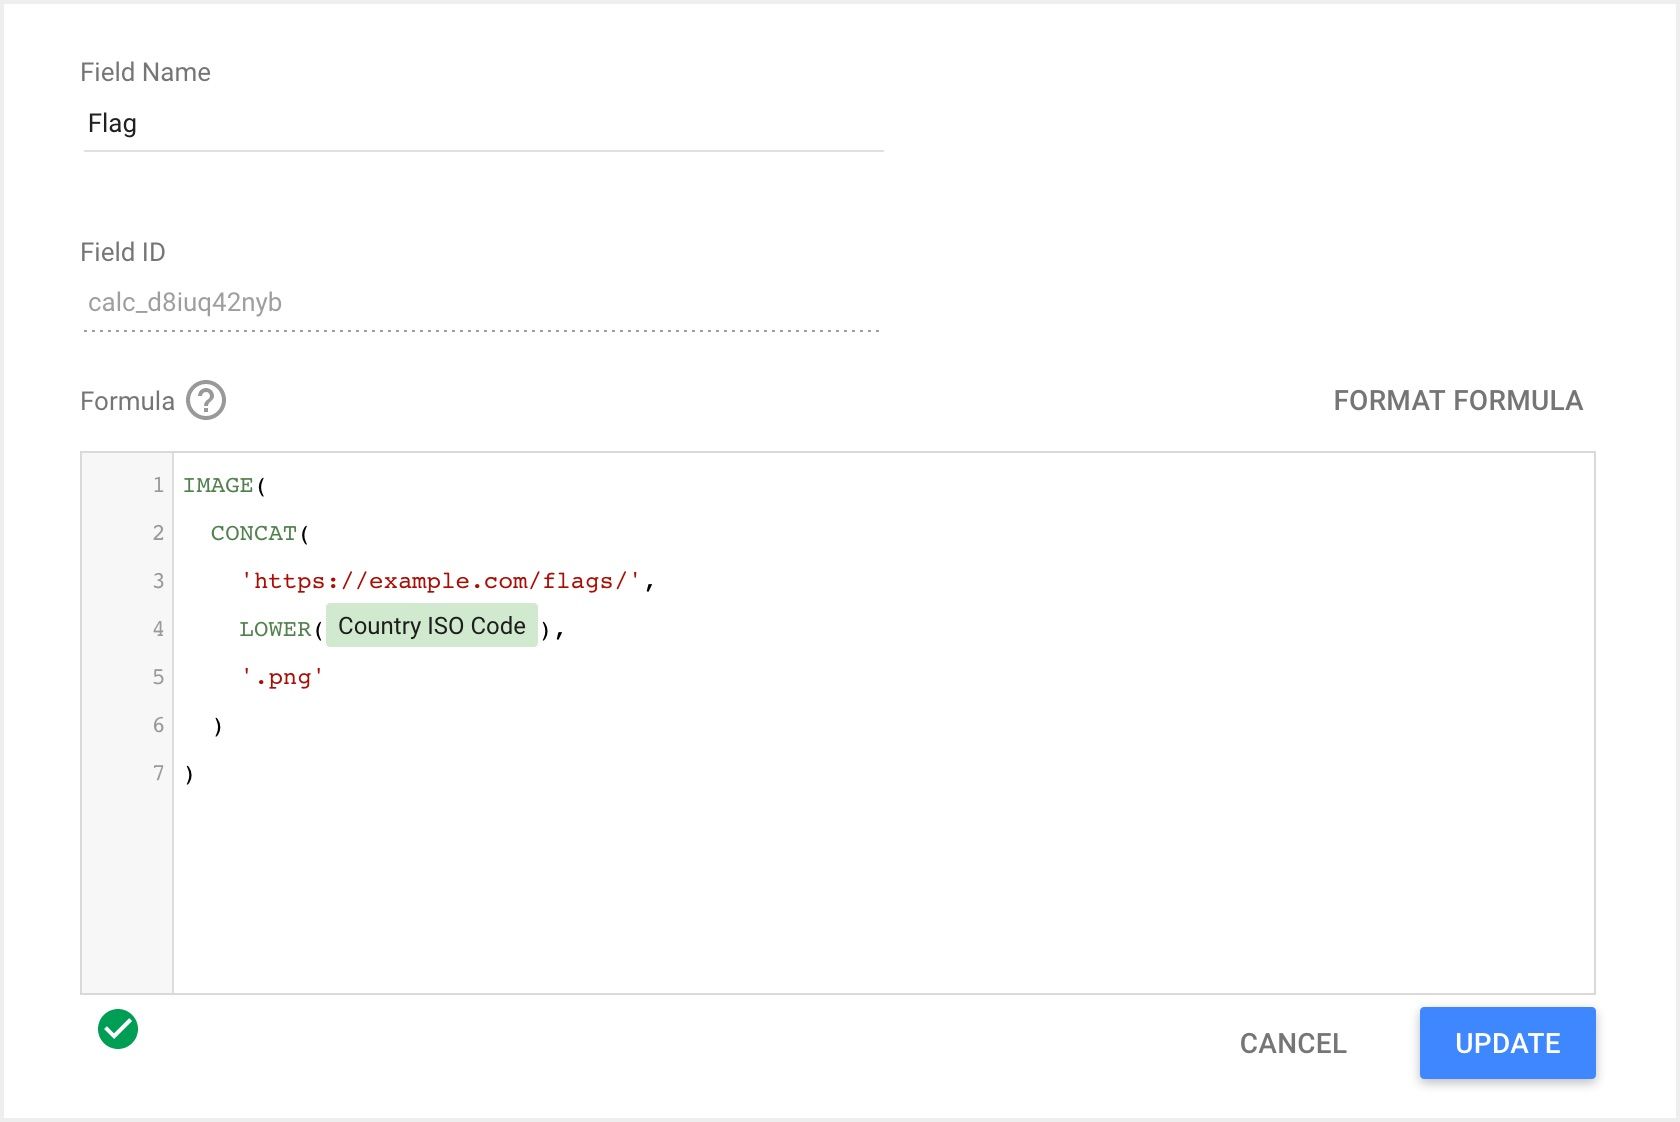
It uses 3 functions:
1- LOWER, to convert Google Analytics "Country ISO Code" field from values like: "US, FR, GB, IN ..." into "us, fr, gb, in ..."
2- CONCAT, to build the flags urls from the domain, country code, and file extension. Example: "https://the-url-we-sent-you-by-email-here/us.png"
3- IMAGE, to create an image field
Step 4: Add the new column to your table
Add the new country flag image field to your table chart as a dimension:
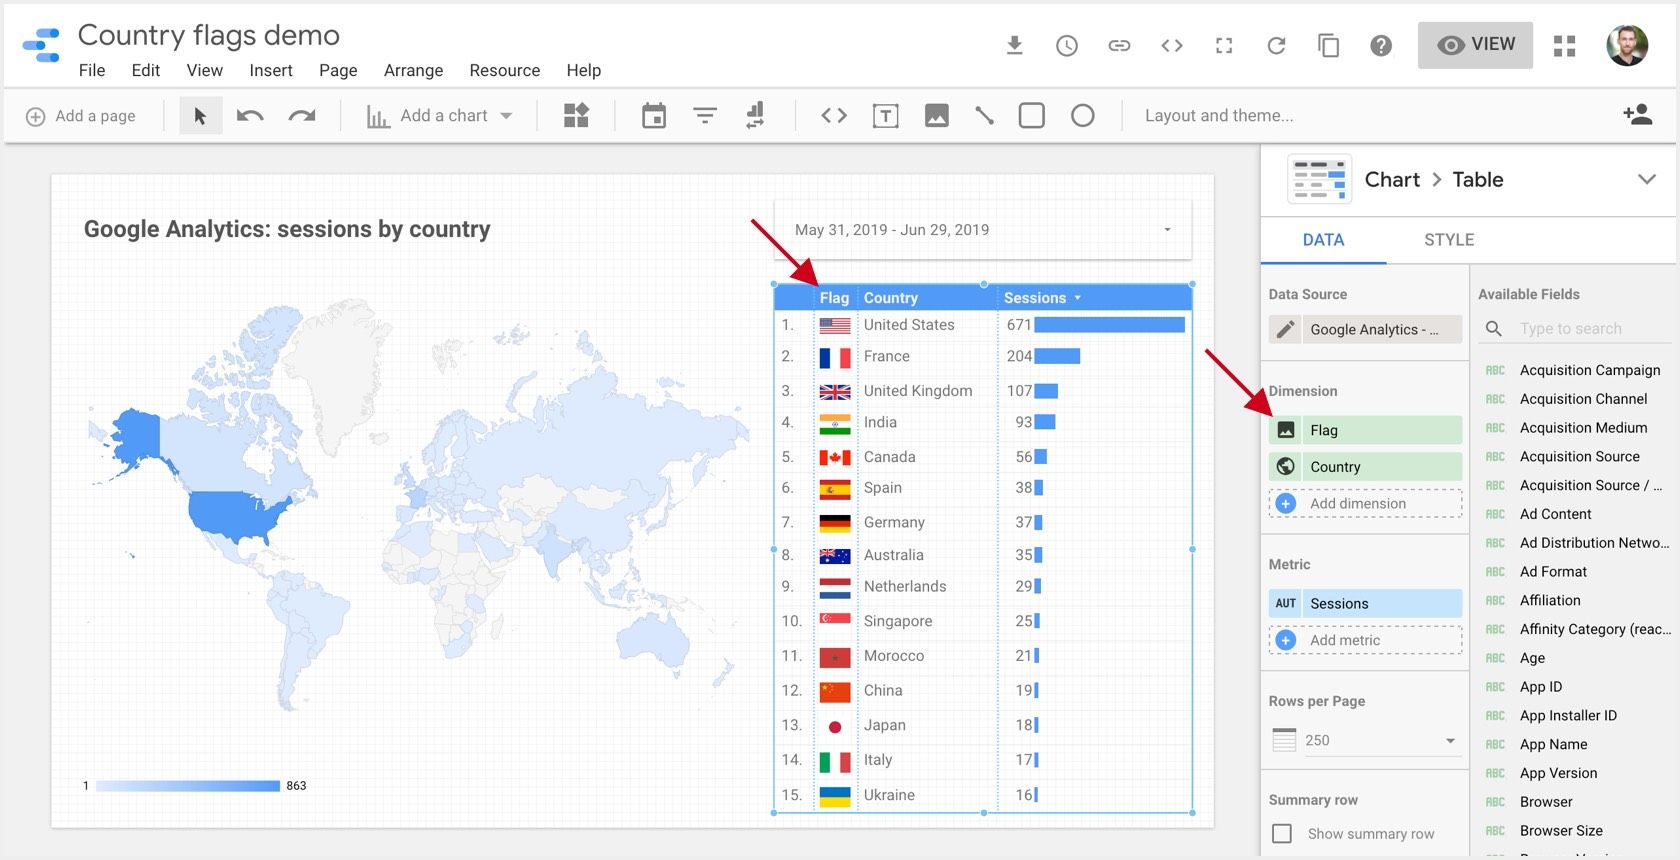
You're done! Here is our end result with Google Analytics data: