This post is old and probably irrelevant today.
28 June 2019
How to filter data across several sources in Google Data Studio
Suppose you manage many websites. You also have created a Google Data Studio report to centralize the most important GA metrics. Now you'd like to let your colleagues explore your report as they wish, by filtering by date, country or else. But how can you filter many charts at once?
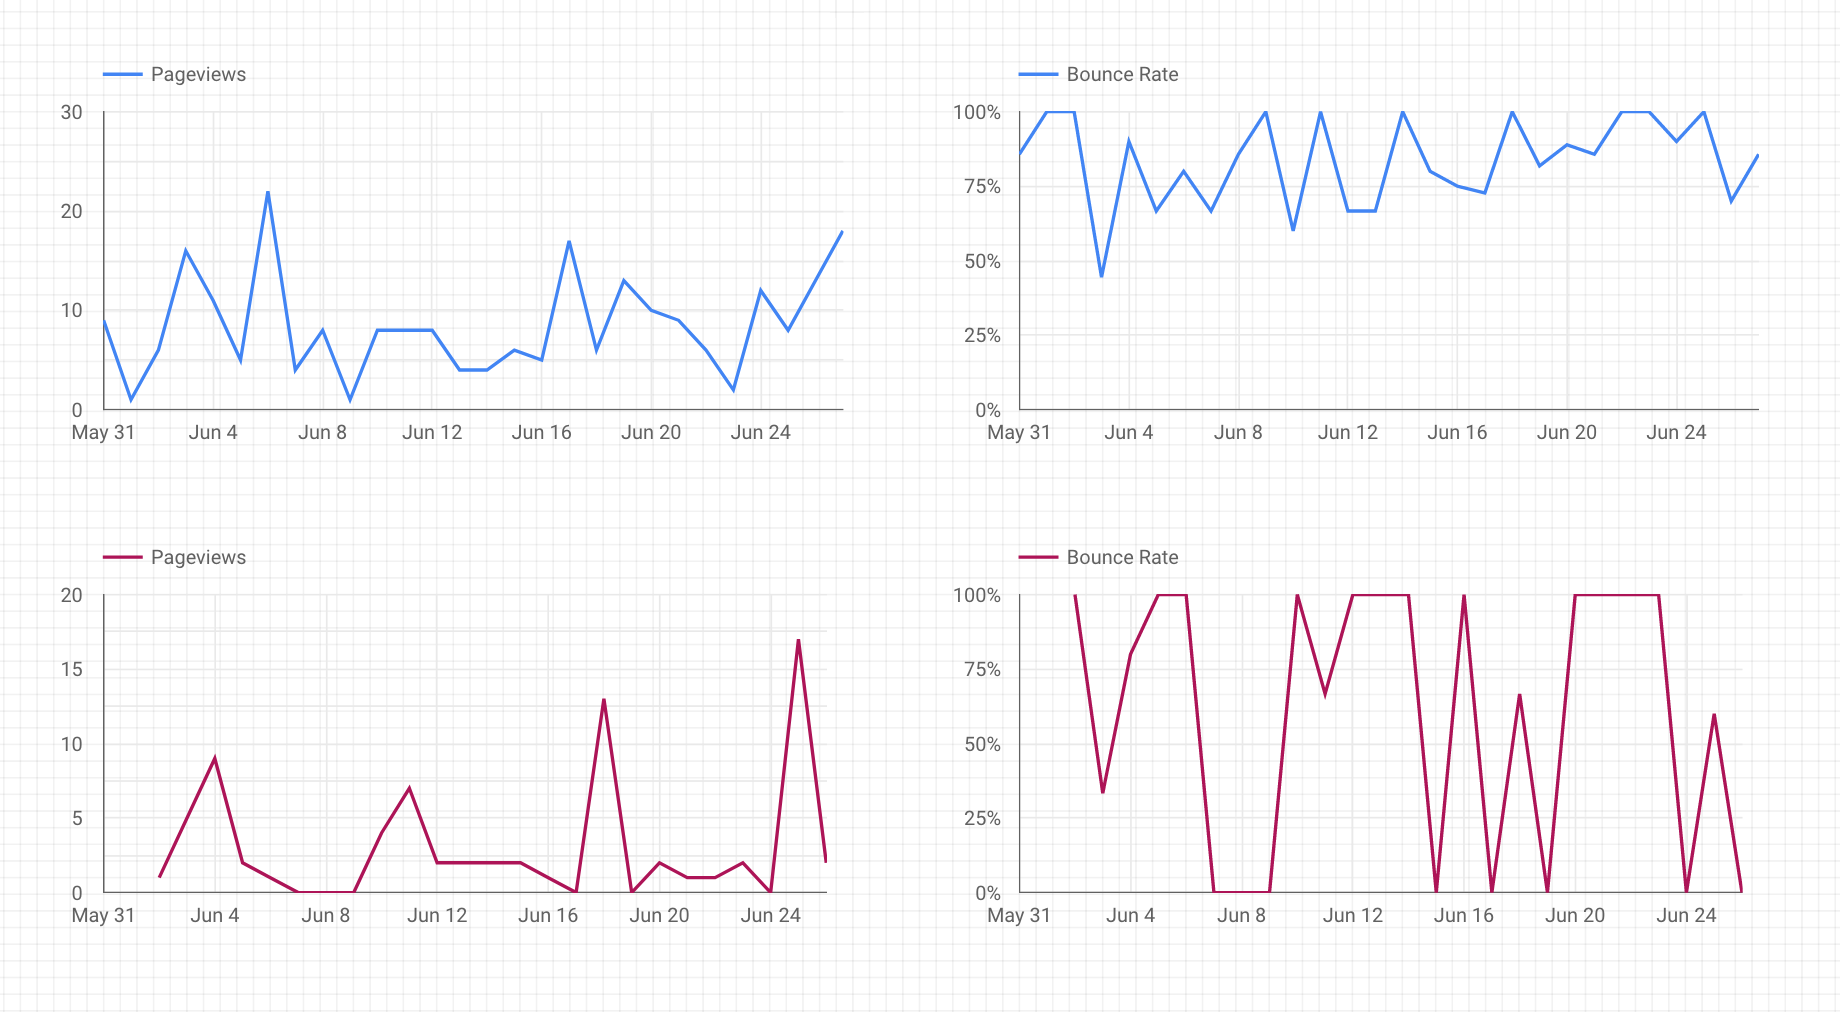
A Data Studio report showing stats from 2 different websites
How to create filters working across several data sources
A common mistake is to use chart-level filters. This is not what you want here because viewers can not change them.
To allow colleagues to filter the charts, you must use report-level filters. It's easy to do, and a single set of filters will drive all your charts, across several data sources.
Add all your data sources
Import your Google Analytics data as a new data source. Do this for each website. If you have a dozen websites, you'll end up with a dozen data sources.
Create you charts
You can choose time-series charts, of course. But feel free to be creative, as any chart can be filtered. The only requirement is that the dimension you want to filter on — e.g. a date or country — must be present in the data source.
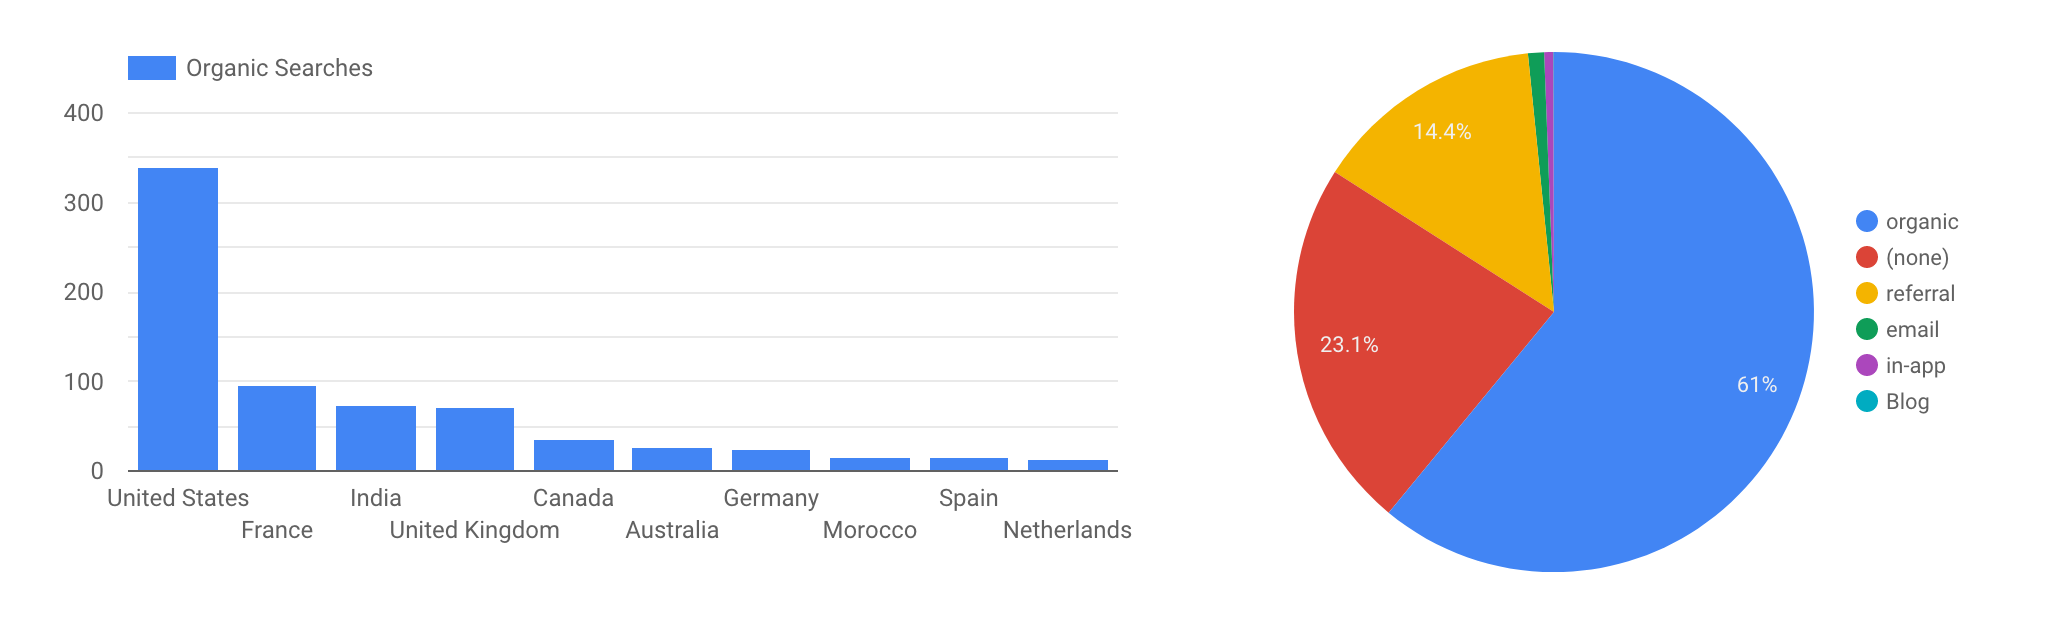
Time-series are not the only chart that can be filtered
Create a date filter
To add a date filter that will apply to all your charts, first click the Date range button. Then click on your report to place it.
Creating a date filter
And that should be enough!
To test it, switch to View mode and select a custom date range. You'll notice that all the charts will be updated to display only the values of the selected date range.
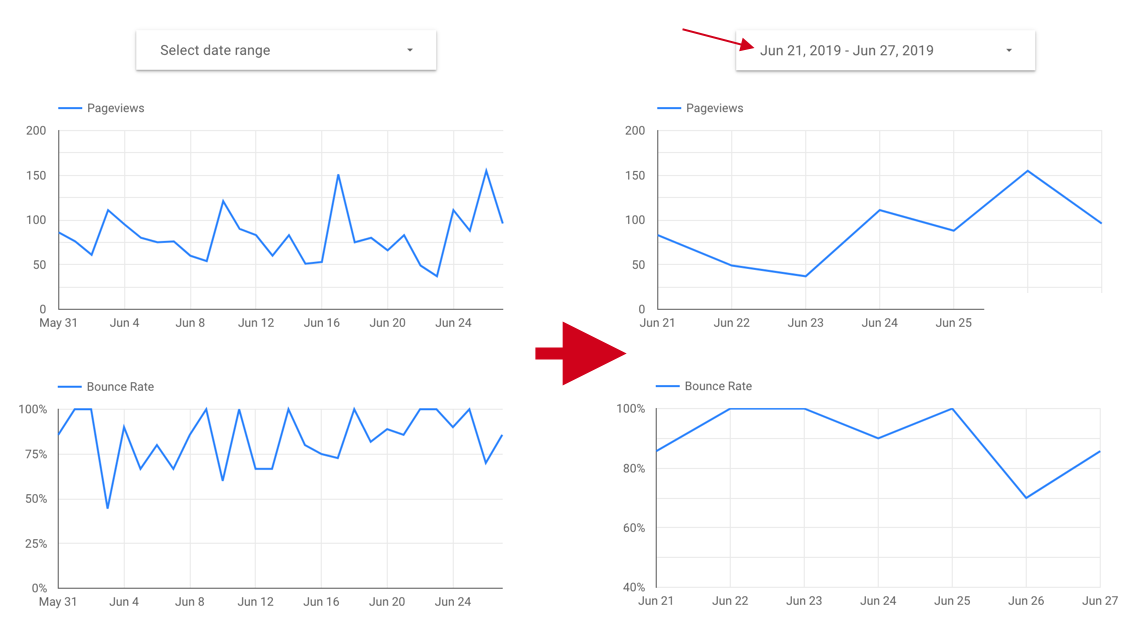
The 2 charts on the right are filtered over the last 7 days
Create a country filter
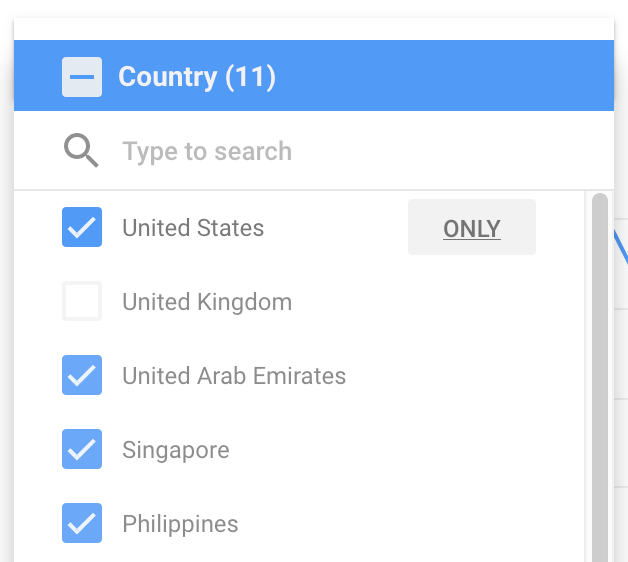
To add a country filter, you must add a Filter control. Then, in the data settings, choose the dimension on which you want to filter. Here, I choose country.
Creating a custom filter
The charts will now be updated as soon as you choose one (or more) countries — as long as all your sources contain a country dimension.
And voilà, your colleagues will love your new filters!