Customer Reviews Visualization for Google Data Studio
This is a Google Data Studio Community Visualization for customer reviews. Use it to add your latest reviews to a report.
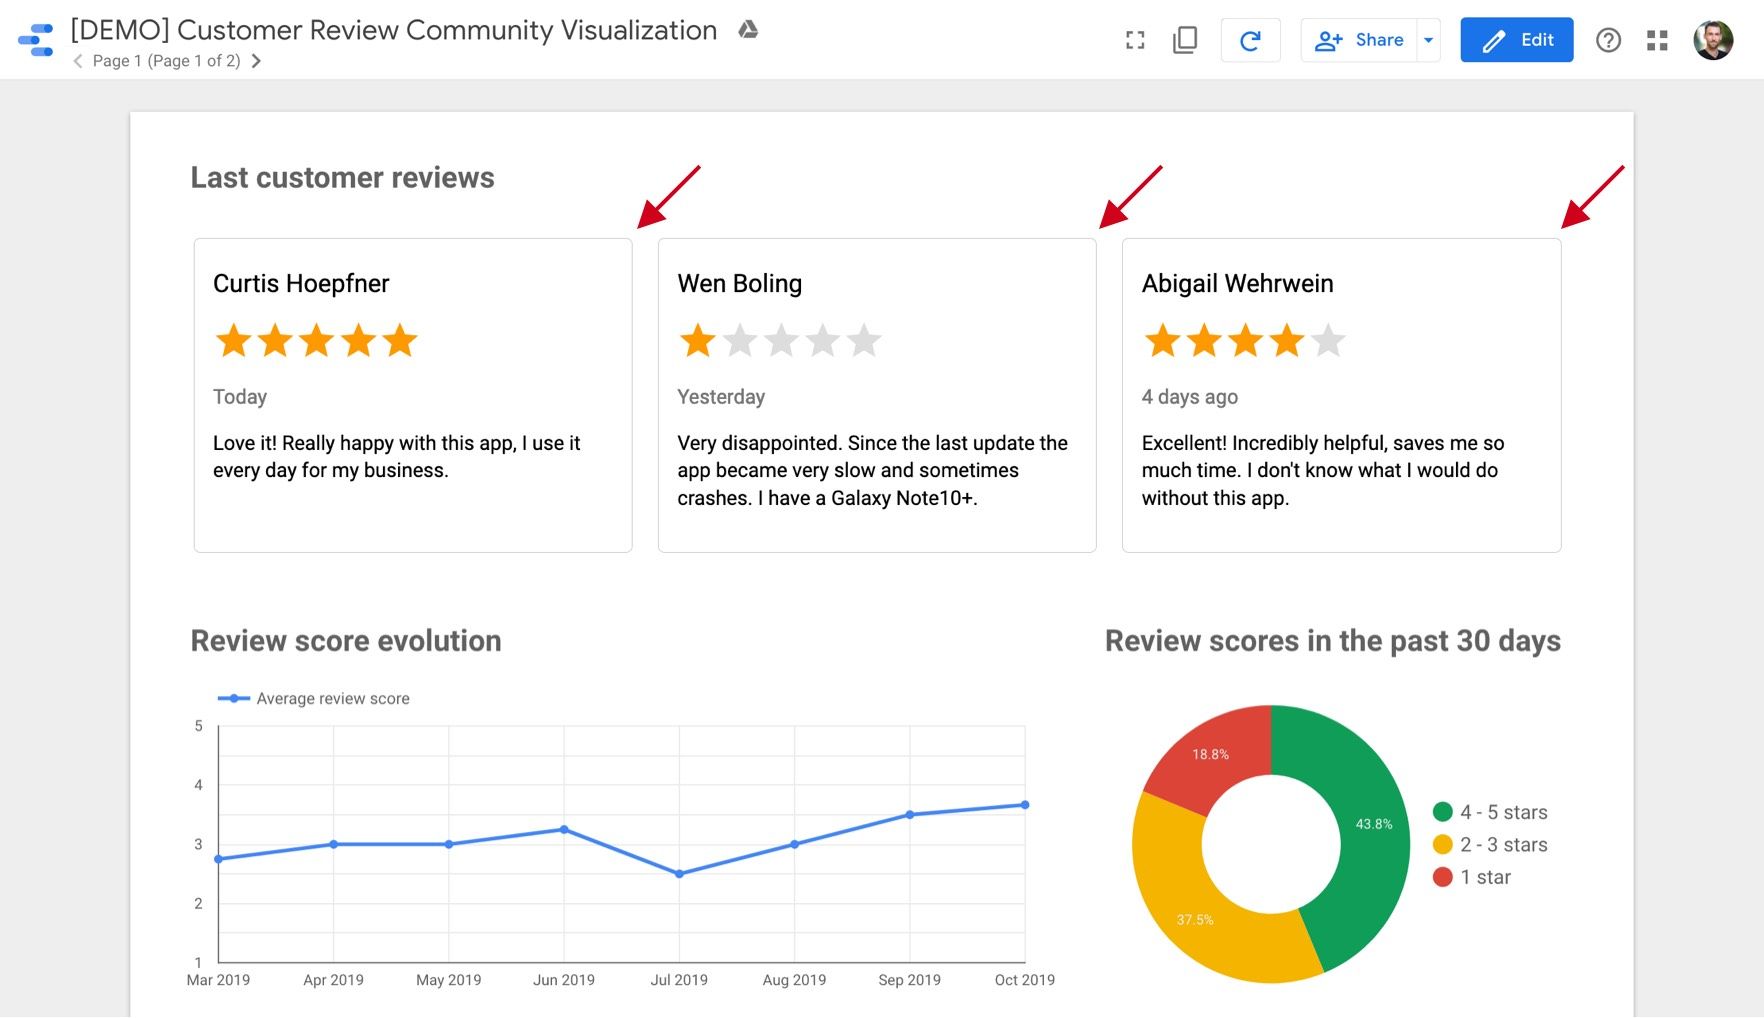
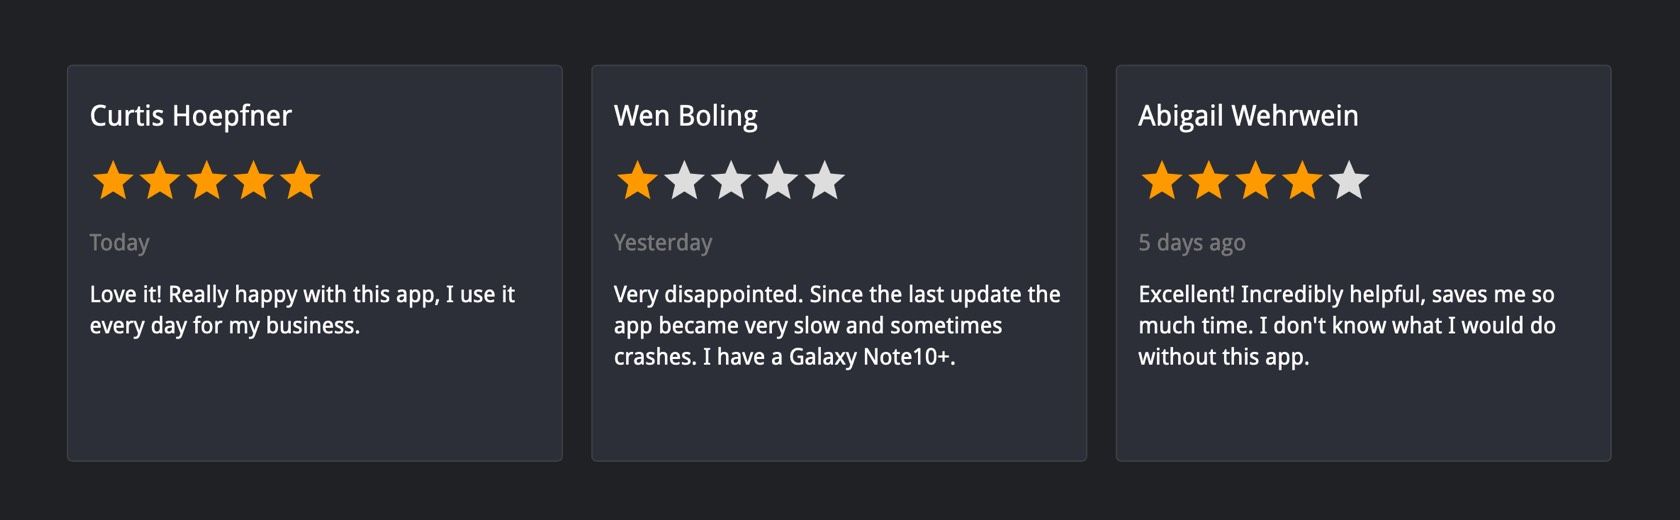
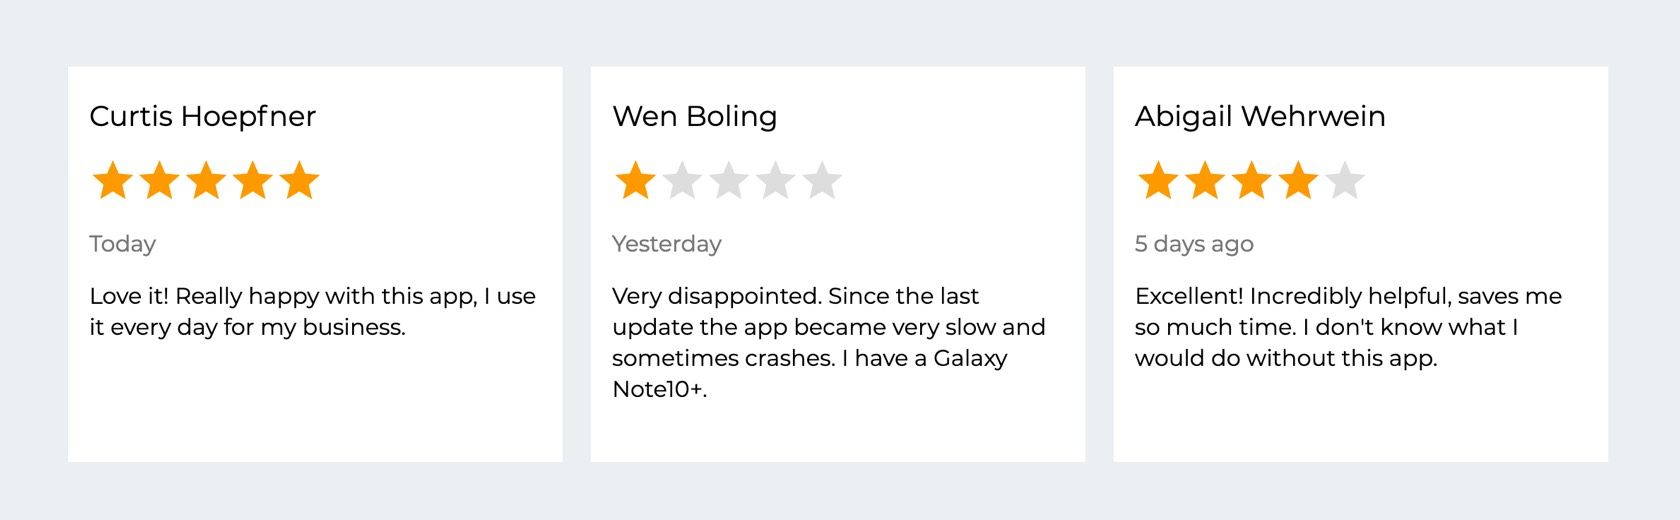
Here is how it looks in a report:
How to add this visualization to your report
1- Add your reviews as a data source
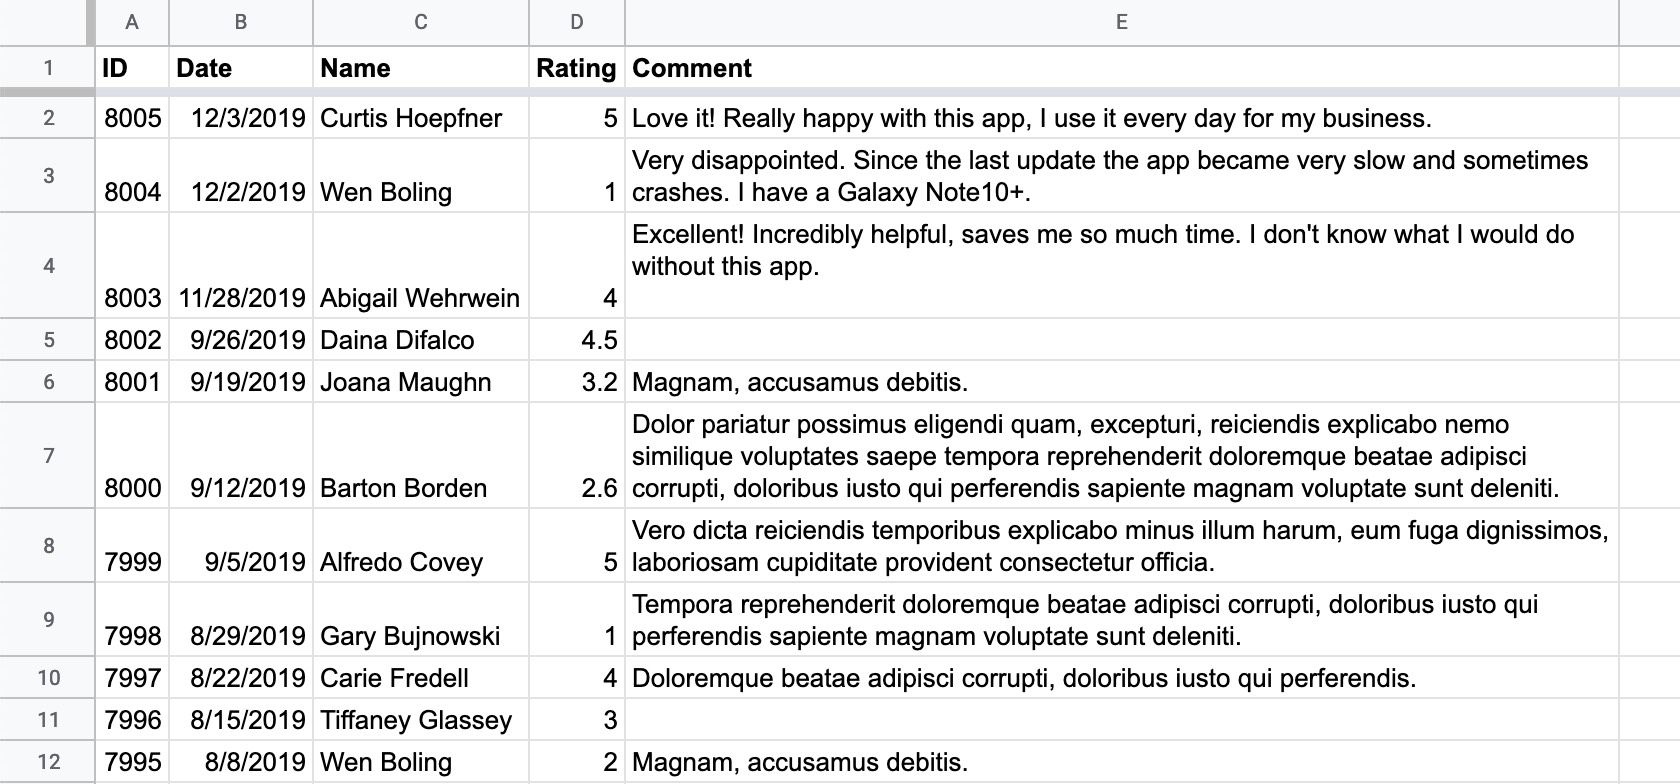
This visualization is designed to work with typical customer reviews data: ID, name, date, rating, comment. As an example, our demo report uses the data from this sample Google Sheet, through the Google Sheets connector.
2- Activate community visualizations
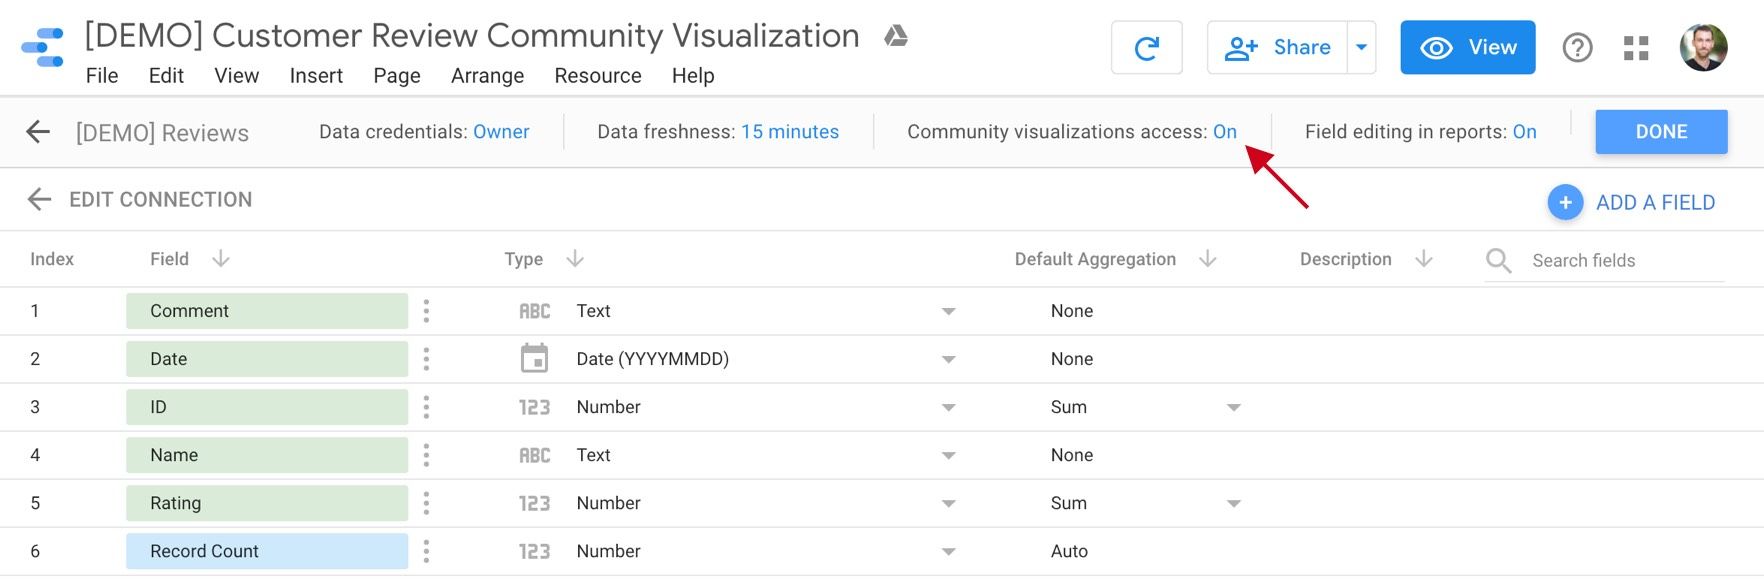
On your reviews data source, set "Community visualizations access" to "On".
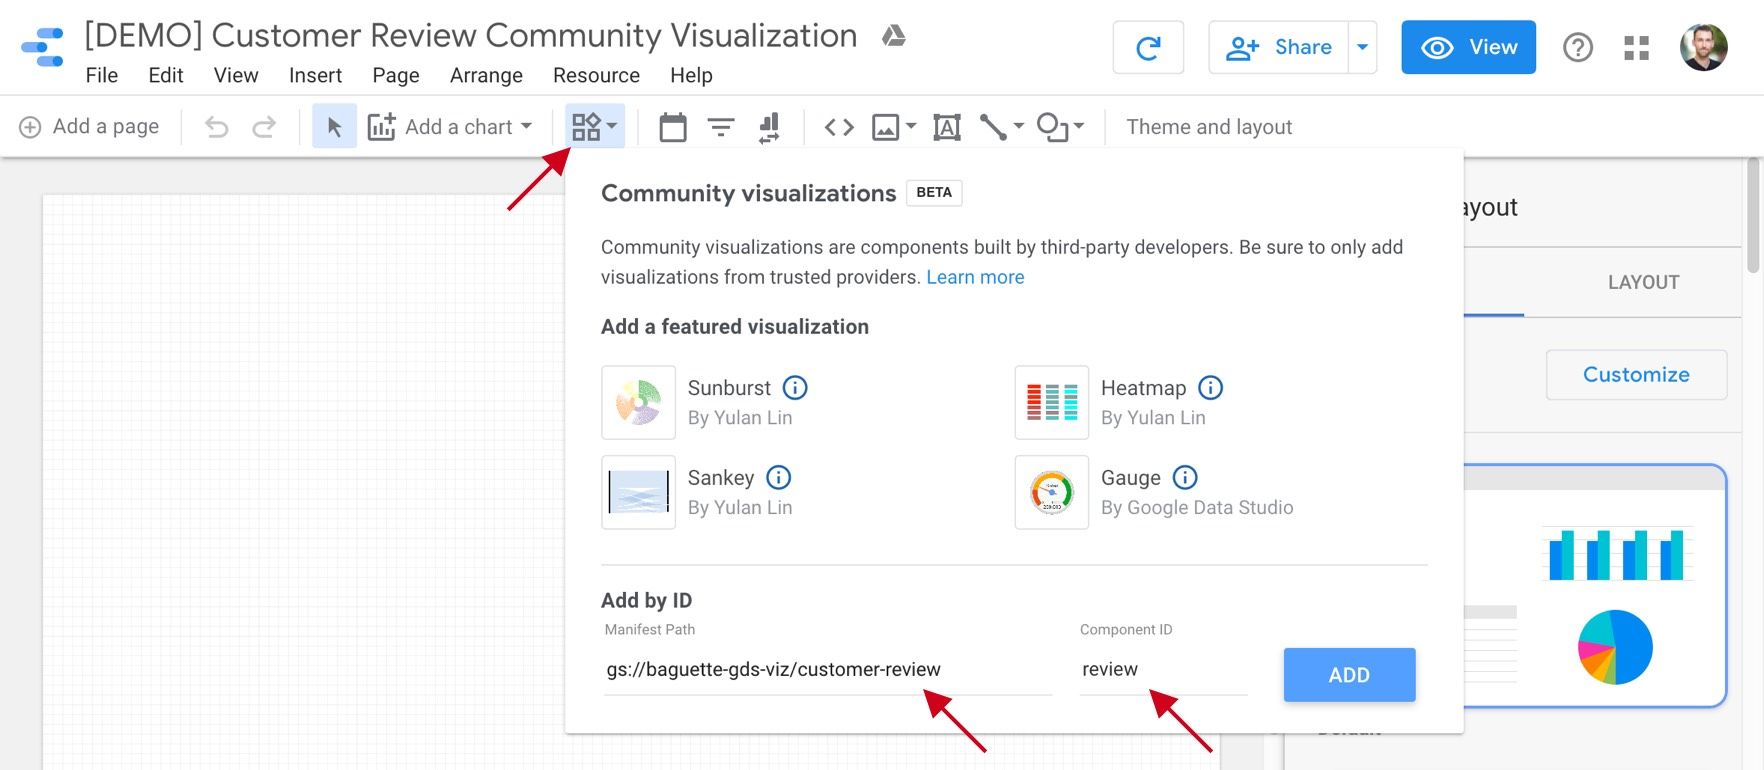
3-Add the visualization
Manifest path: gs://baguette-gds-viz/customer-review
Component ID: review
4- Connect your data
Connect each data field to the corresponding field in your data source.
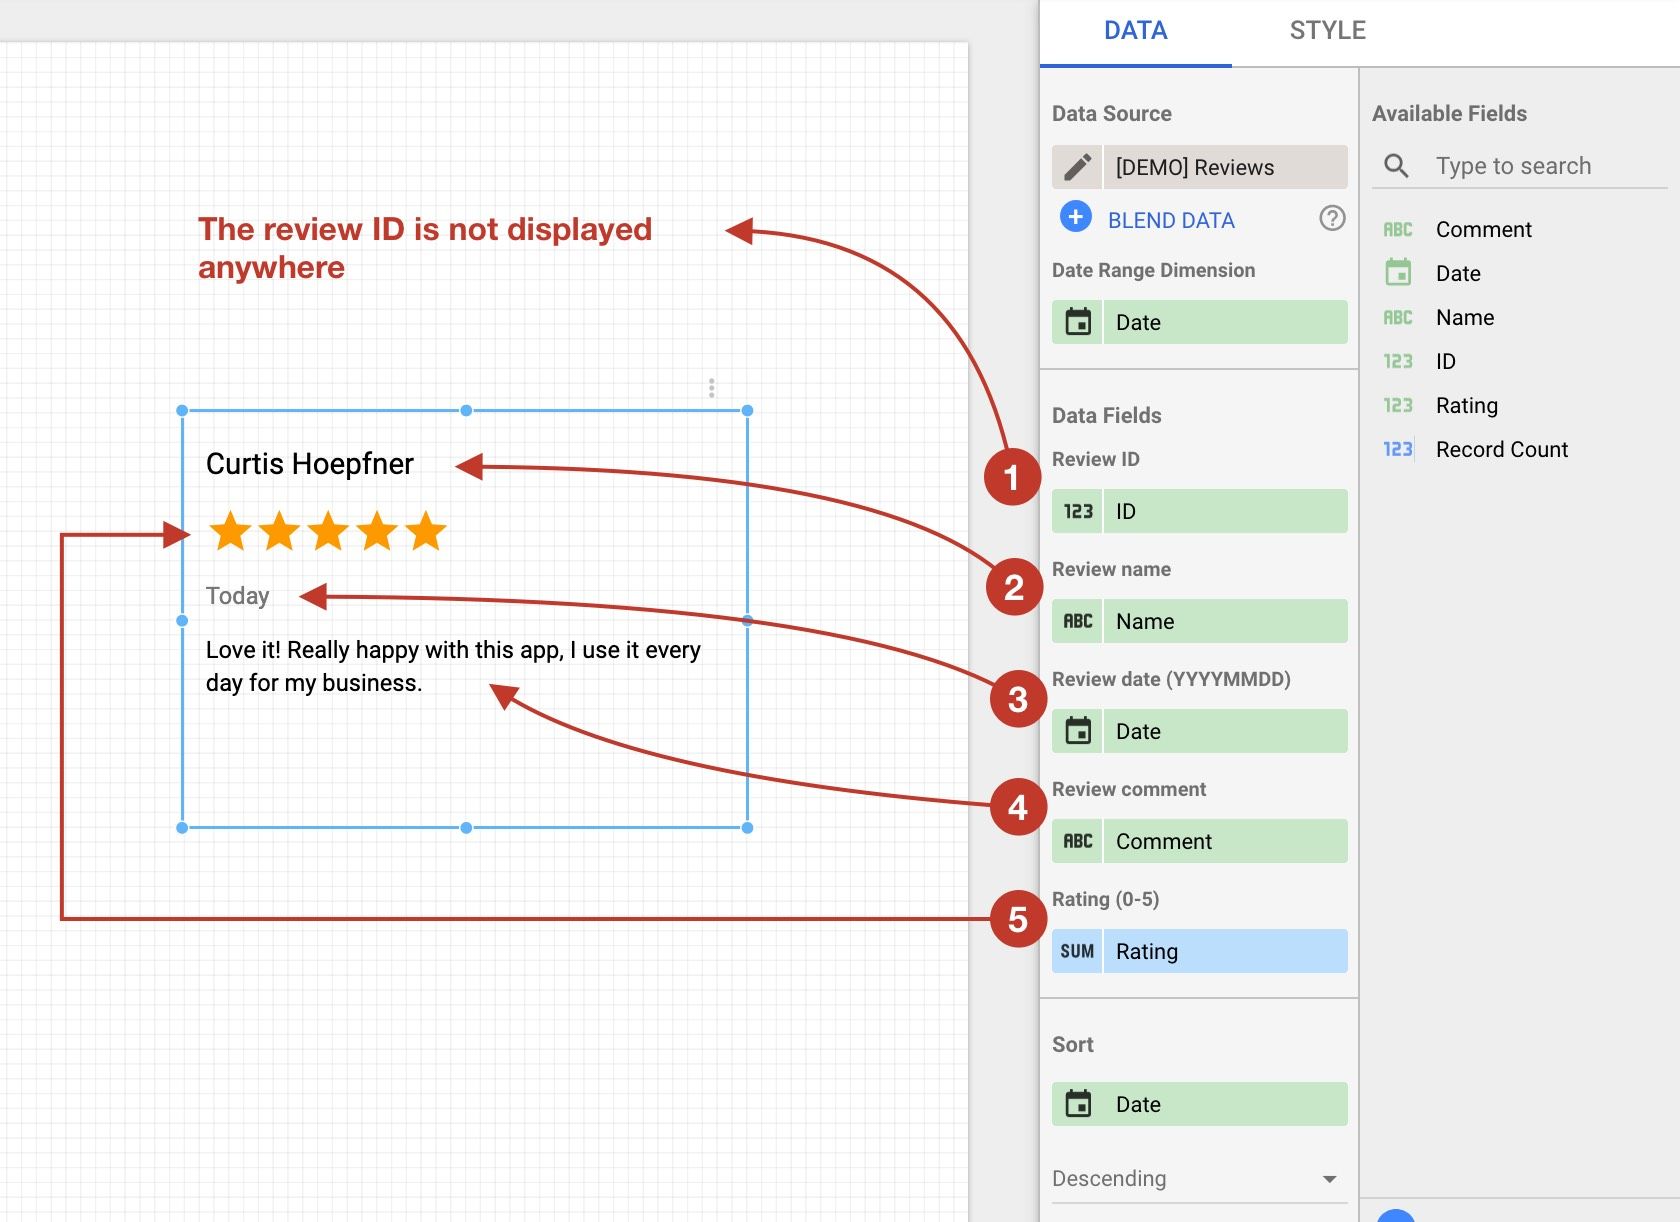
Review ID(1)
Dimension – String or Number
It's not displayed anywhere. It's just here to be sure that records don't get accidentally aggregated if you ever have 2 reviews with the same name/date/comment/rating.
Review date(2)
Dimension – Date at the YYYYMMDD format.
Review name(3)
Dimension – String
Review comment(4)
Dimension – String
Rating(5)
Metric – Number between 0 and 5
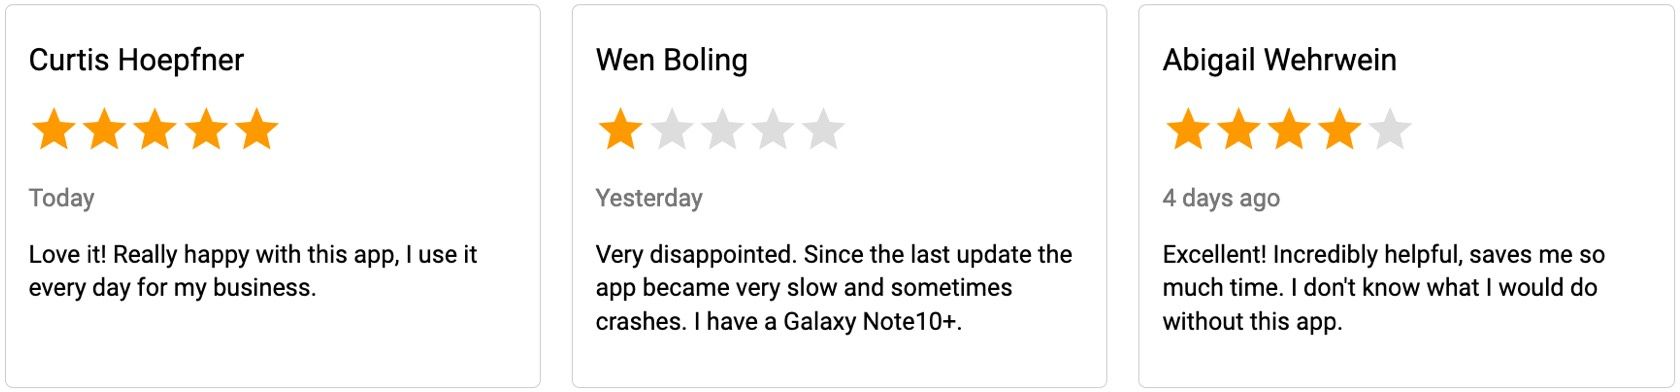
Decimals are rounded to the lower half-star. For example, 3.2 is displayed as 3 stars, 4.6 is displayed as 4 stars and a half.
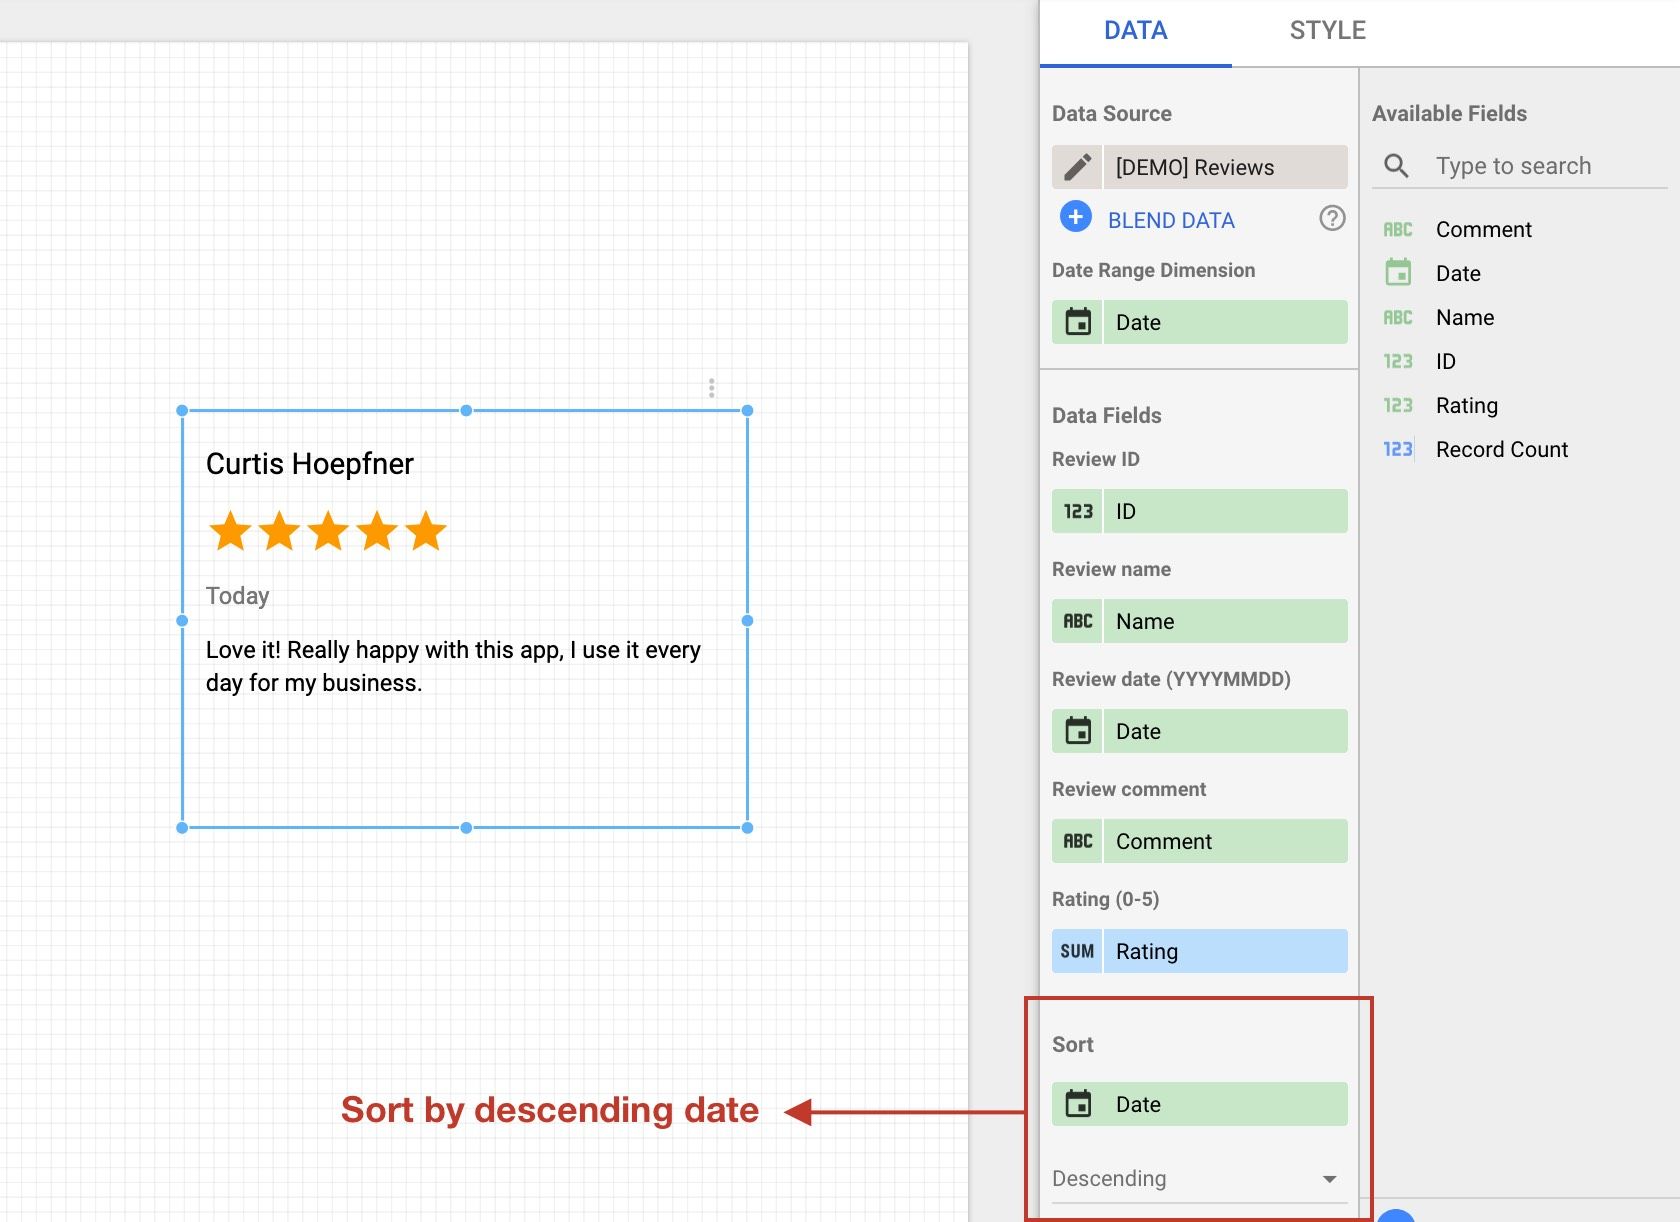
5- Sort by date
Sort your data by descending date so that the most recent reviews appear first.
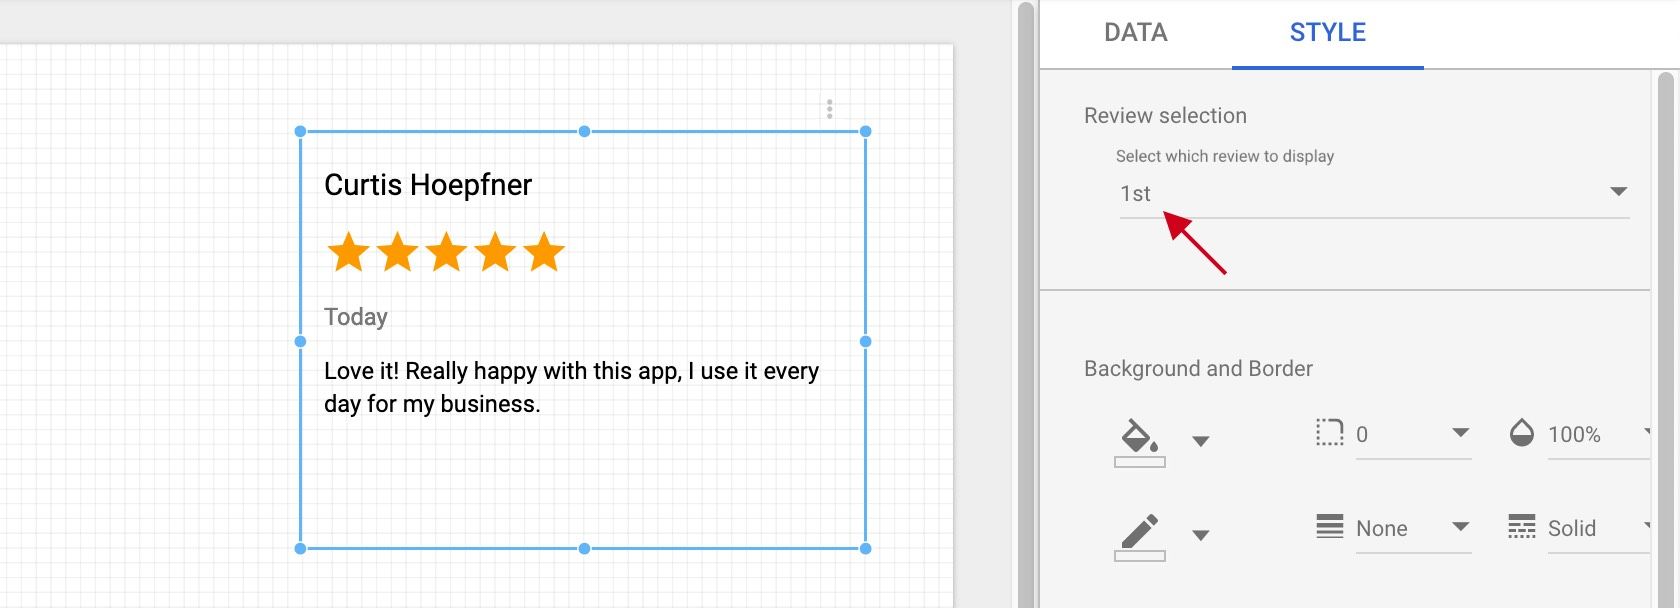
6- Repeat this process
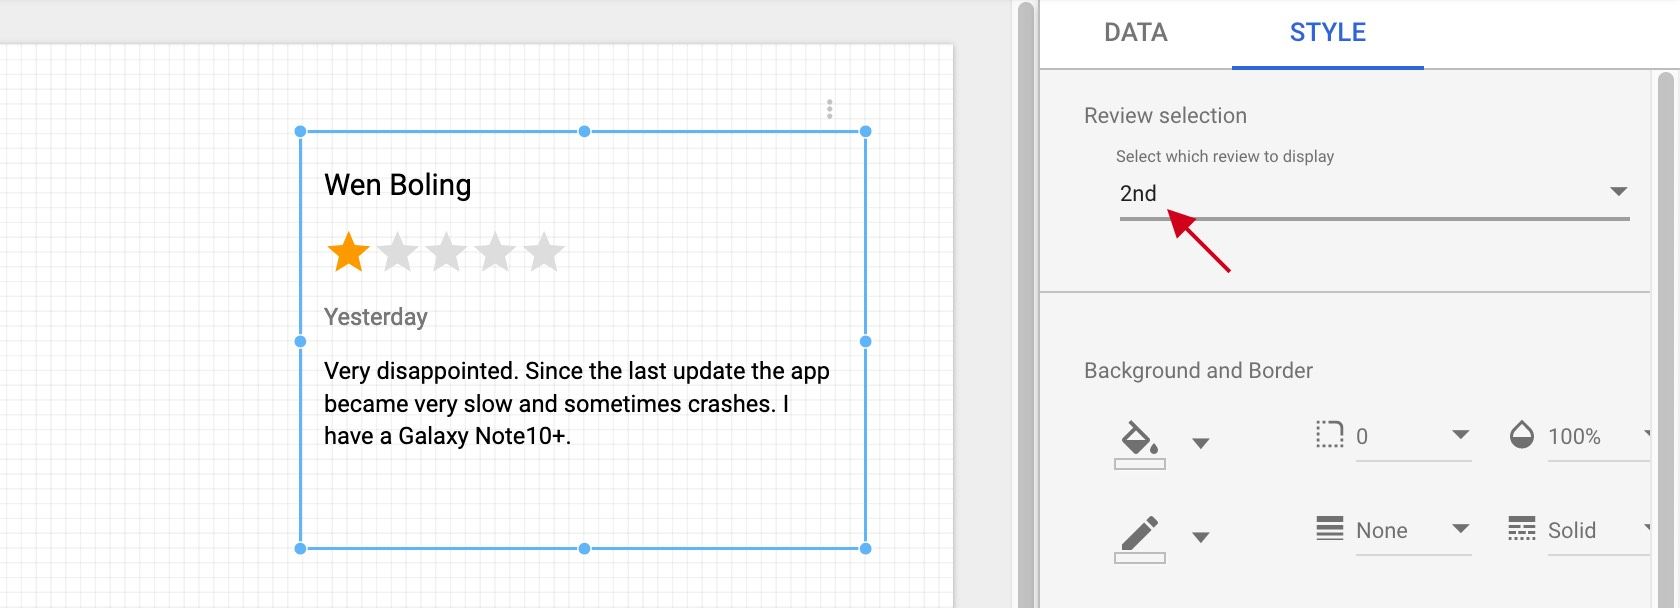
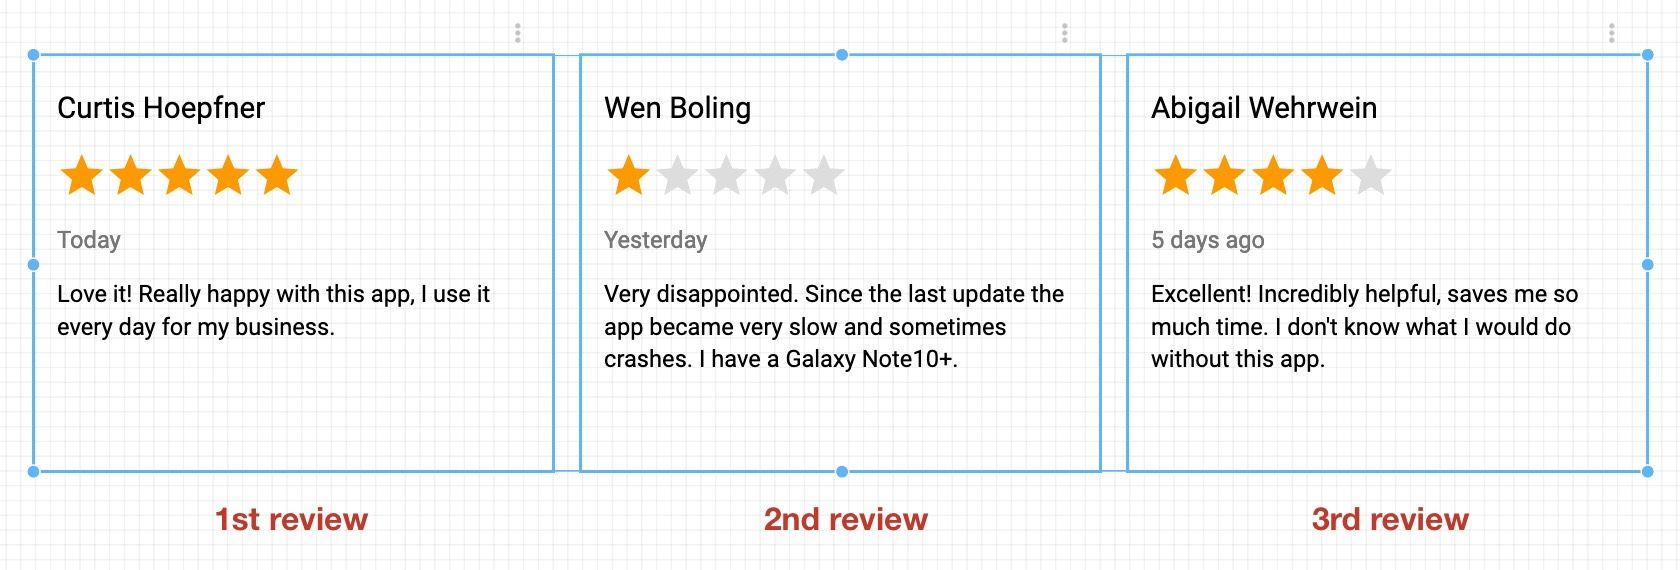
Add more instances of this visualization for multiple reviews. To define which review to display (latest review, latest - 1, latest - 2 ...), select an offset value (1st, 2nd, 3rd ...) in the style tab:
7- Customize the style
This visualization should work well with themes. Feel free to add borders and backgrounds to match the style of your report.
Changelog
December 3, 2019: Change the review selection input from a text to a select field December 2, 2019: Release the first version of this visualization
Terms and Credits
By using this visualization, you accept our Terms of Service and Privacy Policy.
This visualization uses:
Support
If you experience issues, please contact us at [email protected].
Please include screenshots and a Google Sheet data sample shared with the address above. Remember to remove sensitive or personally-identifying data.